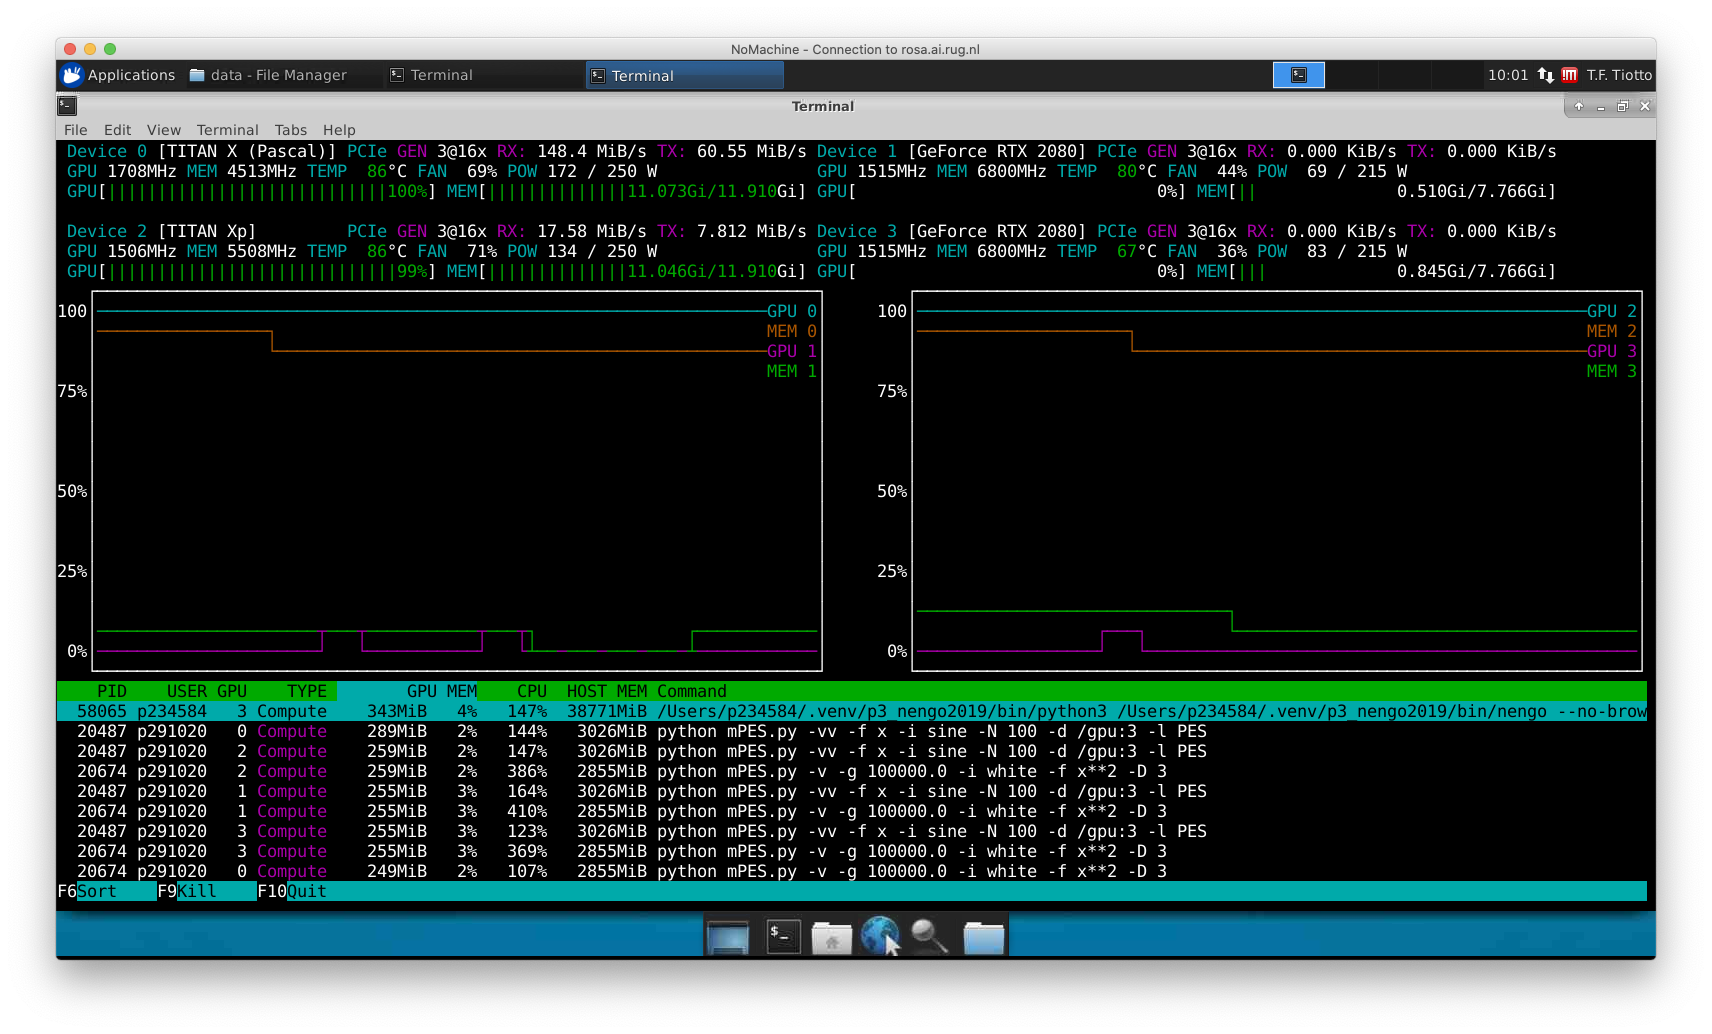
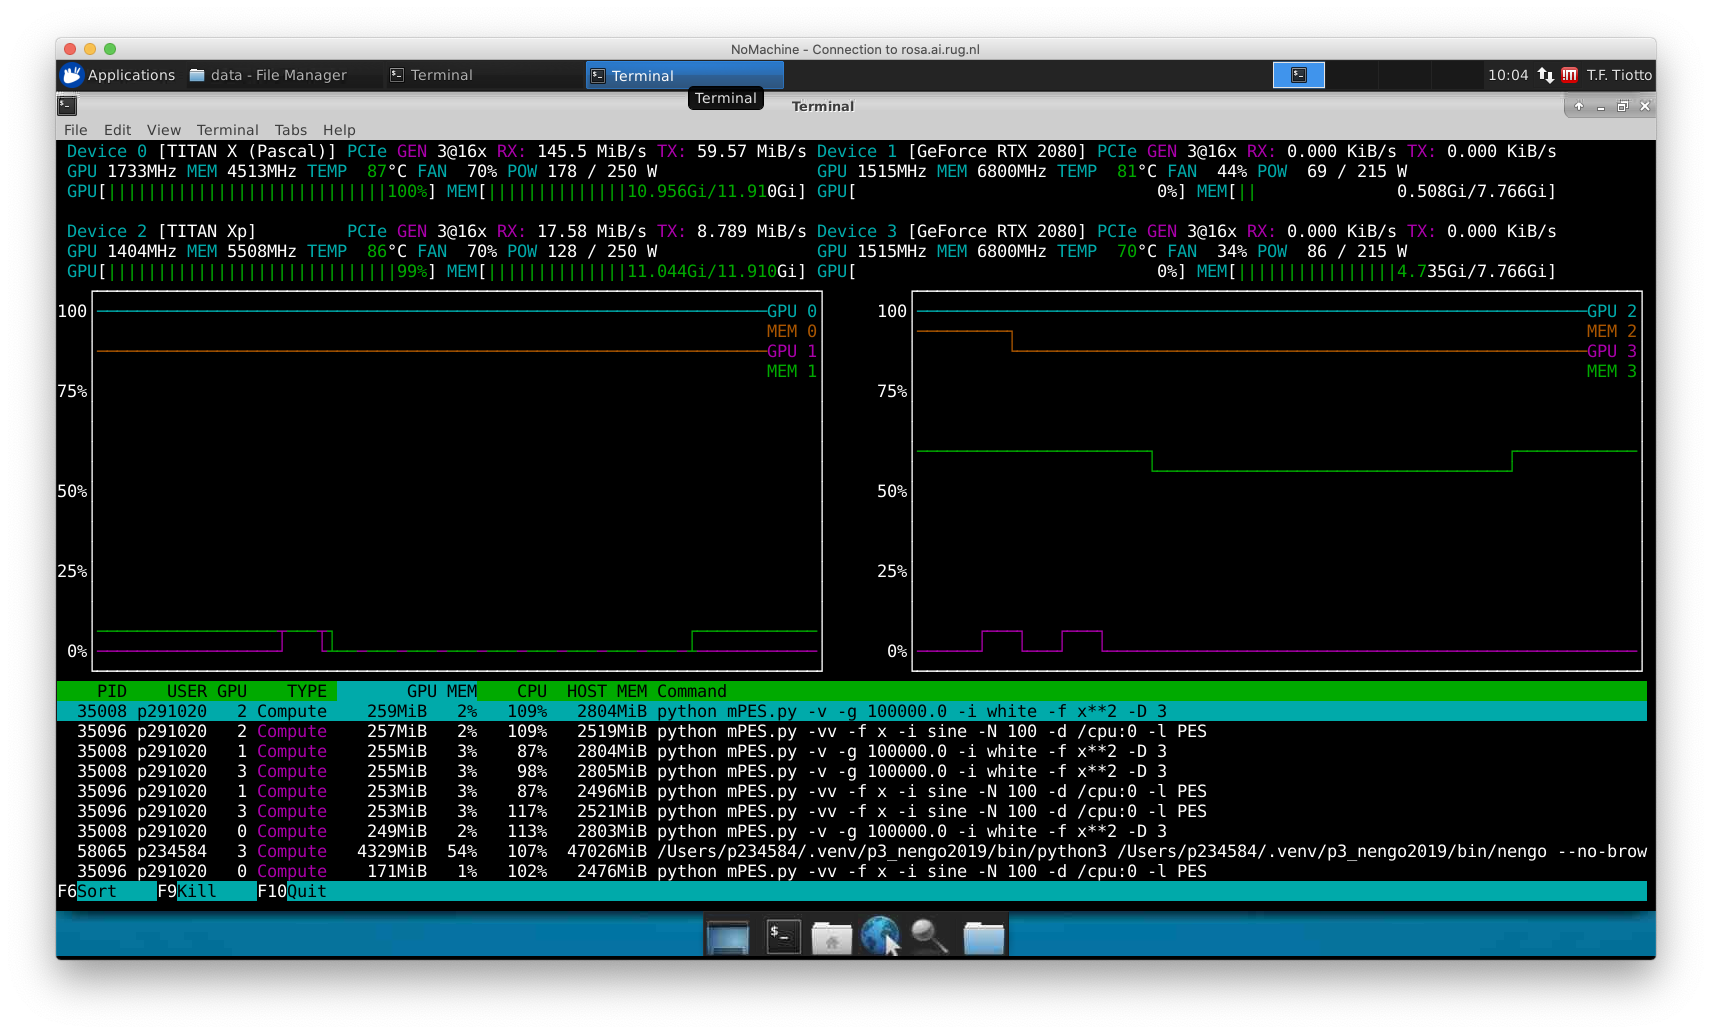
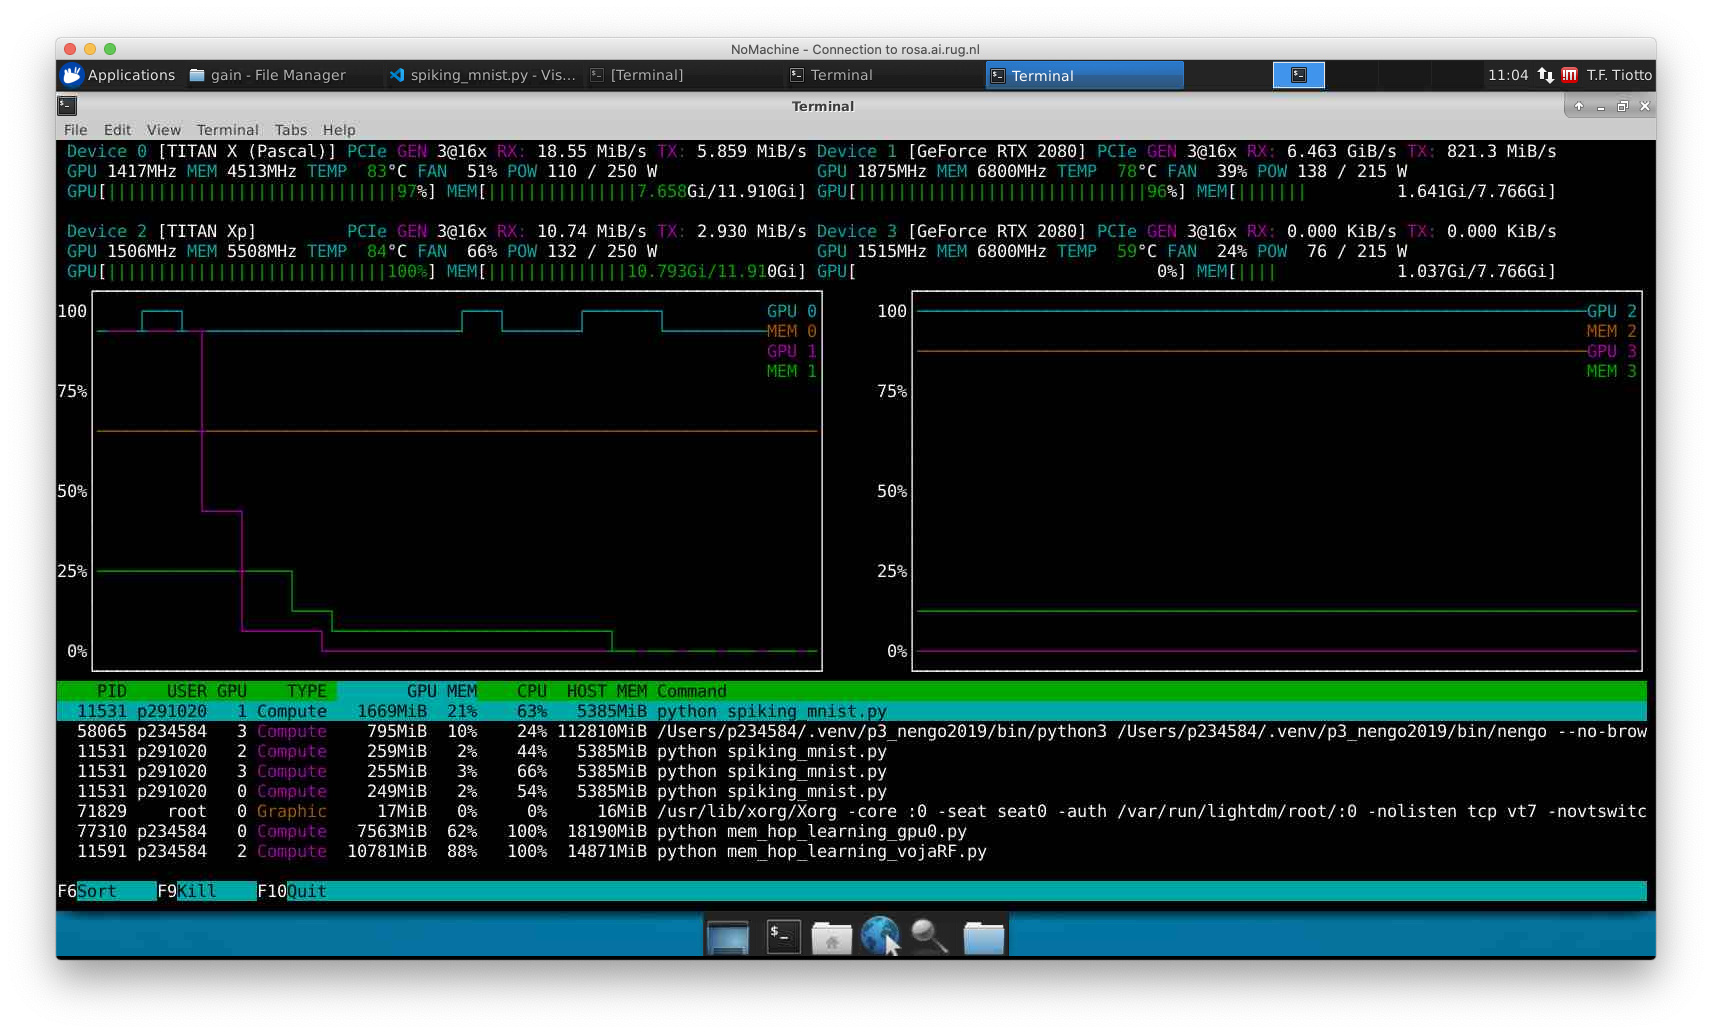
I tried running the “Spiking MNIST” example and it seems that the GPUs are engaged correctly, as per the screenshot:
I specified Simulation(..., device="/gpu:3") but it still seems to auto-select the GPUs.
I’m also getting different messages from TensorFlow when launching the simulation. The GPUs seems to be actually evaluated and initialised for usage:
engodl) p291020@turing10:~$ python spiking_mnist.py
2020-09-17 11:11:49.741587: I tensorflow/stream_executor/platform/default/dso_loader.cc:48] Successfully opened dynamic library libcudart.so.10.1
Build finished in 0:00:00
Optimization finished in 0:00:00
|#                                                                Constructing graph                                                                 | 0:00:002020-09-17 11:11:58.019755: I tensorflow/stream_executor/platform/default/dso_loader.cc:48] Successfully opened dynamic library libcuda.so.1
2020-09-17 11:11:58.050366: I tensorflow/core/common_runtime/gpu/gpu_device.cc:1716] Found device 0 with properties:
pciBusID: 0000:04:00.0 name: GeForce RTX 2080 computeCapability: 7.5
coreClock: 1.71GHz coreCount: 46 deviceMemorySize: 7.77GiB deviceMemoryBandwidth: 417.23GiB/s
2020-09-17 11:11:58.051783: I tensorflow/core/common_runtime/gpu/gpu_device.cc:1716] Found device 1 with properties:
pciBusID: 0000:84:00.0 name: GeForce RTX 2080 computeCapability: 7.5
coreClock: 1.71GHz coreCount: 46 deviceMemorySize: 7.77GiB deviceMemoryBandwidth: 417.23GiB/s
2020-09-17 11:11:58.052579: I tensorflow/core/common_runtime/gpu/gpu_device.cc:1716] Found device 2 with properties:
pciBusID: 0000:83:00.0 name: TITAN Xp computeCapability: 6.1
coreClock: 1.582GHz coreCount: 30 deviceMemorySize: 11.91GiB deviceMemoryBandwidth: 510.07GiB/s
2020-09-17 11:11:58.053495: I tensorflow/core/common_runtime/gpu/gpu_device.cc:1716] Found device 3 with properties:
pciBusID: 0000:02:00.0 name: TITAN X (Pascal) computeCapability: 6.1
coreClock: 1.531GHz coreCount: 28 deviceMemorySize: 11.91GiB deviceMemoryBandwidth: 447.48GiB/s
2020-09-17 11:11:58.053542: I tensorflow/stream_executor/platform/default/dso_loader.cc:48] Successfully opened dynamic library libcudart.so.10.1
2020-09-17 11:11:58.056211: I tensorflow/stream_executor/platform/default/dso_loader.cc:48] Successfully opened dynamic library libcublas.so.10
2020-09-17 11:11:58.058455: I tensorflow/stream_executor/platform/default/dso_loader.cc:48] Successfully opened dynamic library libcufft.so.10
2020-09-17 11:11:58.058928: I tensorflow/stream_executor/platform/default/dso_loader.cc:48] Successfully opened dynamic library libcurand.so.10
2020-09-17 11:11:58.061496: I tensorflow/stream_executor/platform/default/dso_loader.cc:48] Successfully opened dynamic library libcusolver.so.10
2020-09-17 11:11:58.063002: I tensorflow/stream_executor/platform/default/dso_loader.cc:48] Successfully opened dynamic library libcusparse.so.10
2020-09-17 11:11:58.068111: I tensorflow/stream_executor/platform/default/dso_loader.cc:48] Successfully opened dynamic library libcudnn.so.7
2020-09-17 11:11:58.086070: I tensorflow/core/common_runtime/gpu/gpu_device.cc:1858] Adding visible gpu devices: 0, 1, 2, 3
2020-09-17 11:11:58.086984: I tensorflow/core/platform/cpu_feature_guard.cc:142] This TensorFlow binary is optimized with oneAPI Deep Neural Network Library (oneDNN)to use the following CPU instructions in performance-critical operations:  AVX2 FMA
To enable them in other operations, rebuild TensorFlow with the appropriate compiler flags.
2020-09-17 11:11:58.135001: I tensorflow/core/platform/profile_utils/cpu_utils.cc:104] CPU Frequency: 2197335000 Hz
2020-09-17 11:11:58.140460: I tensorflow/compiler/xla/service/service.cc:168] XLA service 0x5631e567b2b0 initialized for platform Host (this does not guarantee that XLA will be used). Devices:
2020-09-17 11:11:58.140490: I tensorflow/compiler/xla/service/service.cc:176]   StreamExecutor device (0): Host, Default Version
2020-09-17 11:11:58.813313: I tensorflow/compiler/xla/service/service.cc:168] XLA service 0x5631e50072c0 initialized for platform CUDA (this does not guarantee that XLA will be used). Devices:
2020-09-17 11:11:58.813375: I tensorflow/compiler/xla/service/service.cc:176]   StreamExecutor device (0): GeForce RTX 2080, Compute Capability 7.5
2020-09-17 11:11:58.813394: I tensorflow/compiler/xla/service/service.cc:176]   StreamExecutor device (1): GeForce RTX 2080, Compute Capability 7.5
2020-09-17 11:11:58.813410: I tensorflow/compiler/xla/service/service.cc:176]   StreamExecutor device (2): TITAN Xp, Compute Capability 6.1
2020-09-17 11:11:58.813433: I tensorflow/compiler/xla/service/service.cc:176]   StreamExecutor device (3): TITAN X (Pascal), Compute Capability 6.1
2020-09-17 11:11:58.816386: I tensorflow/core/common_runtime/gpu/gpu_device.cc:1716] Found device 0 with properties:
pciBusID: 0000:04:00.0 name: GeForce RTX 2080 computeCapability: 7.5
coreClock: 1.71GHz coreCount: 46 deviceMemorySize: 7.77GiB deviceMemoryBandwidth: 417.23GiB/s
2020-09-17 11:11:58.819237: I tensorflow/core/common_runtime/gpu/gpu_device.cc:1716] Found device 1 with properties:
pciBusID: 0000:84:00.0 name: GeForce RTX 2080 computeCapability: 7.5
coreClock: 1.71GHz coreCount: 46 deviceMemorySize: 7.77GiB deviceMemoryBandwidth: 417.23GiB/s
2020-09-17 11:11:58.820519: I tensorflow/core/common_runtime/gpu/gpu_device.cc:1716] Found device 2 with properties:
pciBusID: 0000:83:00.0 name: TITAN Xp computeCapability: 6.1
coreClock: 1.582GHz coreCount: 30 deviceMemorySize: 11.91GiB deviceMemoryBandwidth: 510.07GiB/s
2020-09-17 11:11:58.821905: I tensorflow/core/common_runtime/gpu/gpu_device.cc:1716] Found device 3 with properties:
pciBusID: 0000:02:00.0 name: TITAN X (Pascal) computeCapability: 6.1
coreClock: 1.531GHz coreCount: 28 deviceMemorySize: 11.91GiB deviceMemoryBandwidth: 447.48GiB/s
2020-09-17 11:11:58.821974: I tensorflow/stream_executor/platform/default/dso_loader.cc:48] Successfully opened dynamic library libcudart.so.10.1
2020-09-17 11:11:58.822025: I tensorflow/stream_executor/platform/default/dso_loader.cc:48] Successfully opened dynamic library libcublas.so.10
2020-09-17 11:11:58.822058: I tensorflow/stream_executor/platform/default/dso_loader.cc:48] Successfully opened dynamic library libcufft.so.10
2020-09-17 11:11:58.822089: I tensorflow/stream_executor/platform/default/dso_loader.cc:48] Successfully opened dynamic library libcurand.so.10
2020-09-17 11:11:58.822128: I tensorflow/stream_executor/platform/default/dso_loader.cc:48] Successfully opened dynamic library libcusolver.so.10
2020-09-17 11:11:58.822158: I tensorflow/stream_executor/platform/default/dso_loader.cc:48] Successfully opened dynamic library libcusparse.so.10
2020-09-17 11:11:58.822189: I tensorflow/stream_executor/platform/default/dso_loader.cc:48] Successfully opened dynamic library libcudnn.so.7
2020-09-17 11:11:58.830921: I tensorflow/core/common_runtime/gpu/gpu_device.cc:1858] Adding visible gpu devices: 0, 1, 2, 3
2020-09-17 11:11:58.830969: I tensorflow/stream_executor/platform/default/dso_loader.cc:48] Successfully opened dynamic library libcudart.so.10.1
2020-09-17 11:12:03.172575: I tensorflow/core/common_runtime/gpu/gpu_device.cc:1257] Device interconnect StreamExecutor with strength 1 edge matrix:
2020-09-17 11:12:03.172636: I tensorflow/core/common_runtime/gpu/gpu_device.cc:1263]      0 1 2 3
2020-09-17 11:12:03.172661: I tensorflow/core/common_runtime/gpu/gpu_device.cc:1276] 0:   N N N N
2020-09-17 11:12:03.172666: I tensorflow/core/common_runtime/gpu/gpu_device.cc:1276] 1:   N N N N
2020-09-17 11:12:03.172671: I tensorflow/core/common_runtime/gpu/gpu_device.cc:1276] 2:   N N N N
2020-09-17 11:12:03.172678: I tensorflow/core/common_runtime/gpu/gpu_device.cc:1276] 3:   N N N N
2020-09-17 11:12:03.178388: W tensorflow/core/common_runtime/gpu/gpu_bfc_allocator.cc:39] Overriding allow_growth setting because the TF_FORCE_GPU_ALLOW_GROWTH environment variable is set. Original config value was 0.
2020-09-17 11:12:03.178476: I tensorflow/core/common_runtime/gpu/gpu_device.cc:1402] Created TensorFlow device (/job:localhost/replica:0/task:0/device:GPU:0 with 7226 MB memory) -> physical GPU (device: 0, name: GeForce RTX 2080, pci bus id: 0000:04:00.0, compute capability: 7.5)
2020-09-17 11:12:03.180294: W tensorflow/core/common_runtime/gpu/gpu_bfc_allocator.cc:39] Overriding allow_growth setting because the TF_FORCE_GPU_ALLOW_GROWTH environment variable is set. Original config value was 0.
2020-09-17 11:12:03.180340: I tensorflow/core/common_runtime/gpu/gpu_device.cc:1402] Created TensorFlow device (/job:localhost/replica:0/task:0/device:GPU:1 with 7226 MB memory) -> physical GPU (device: 1, name: GeForce RTX 2080, pci bus id: 0000:84:00.0, compute capability: 7.5)
2020-09-17 11:12:03.181790: W tensorflow/core/common_runtime/gpu/gpu_bfc_allocator.cc:39] Overriding allow_growth setting because the TF_FORCE_GPU_ALLOW_GROWTH environment variable is set. Original config value was 0.
2020-09-17 11:12:03.181834: I tensorflow/core/common_runtime/gpu/gpu_device.cc:1402] Created TensorFlow device (/job:localhost/replica:0/task:0/device:GPU:2 with 921 MB memory) -> physical GPU (device: 2, name: TITAN Xp, pci bus id: 0000:83:00.0, compute capability: 6.1)
2020-09-17 11:12:03.183548: W tensorflow/core/common_runtime/gpu/gpu_bfc_allocator.cc:39] Overriding allow_growth setting because the TF_FORCE_GPU_ALLOW_GROWTH environment variable is set. Original config value was 0.
2020-09-17 11:12:03.183609: I tensorflow/core/common_runtime/gpu/gpu_device.cc:1402] Created TensorFlow device (/job:localhost/replica:0/task:0/device:GPU:3 with 4056 MB memory) -> physical GPU (device: 3, name: TITAN X (Pascal), pci bus id: 0000:02:00.0, compute capability: 6.1)
Construction finished in 0:00:05
2020-09-17 11:12:07.284170: I tensorflow/stream_executor/platform/default/dso_loader.cc:48] Successfully opened dynamic library libcublas.so.10
2020-09-17 11:12:07.786281: I tensorflow/stream_executor/platform/default/dso_loader.cc:48] Successfully opened dynamic library libcudnn.so.7
Accuracy before training: 0.0934000015258789
Accuracy after training: 0.9869999885559082 0:00:00
(nengodl) p291020@turing10:~$ python spiking_mnist.py
2020-09-17 11:13:31.472787: I tensorflow/stream_executor/platform/default/dso_loader.cc:48] Successfully opened dynamic library libcudart.so.10.1
Build finished in 0:00:00
Optimization finished in 0:00:00
|#                                                                Constructing graph                                                                 | 0:00:002020-09-17 11:13:41.757297: I tensorflow/stream_executor/platform/default/dso_loader.cc:48] Successfully opened dynamic library libcuda.so.1
2020-09-17 11:13:41.779979: I tensorflow/core/common_runtime/gpu/gpu_device.cc:1716] Found device 0 with properties:
pciBusID: 0000:04:00.0 name: GeForce RTX 2080 computeCapability: 7.5
coreClock: 1.71GHz coreCount: 46 deviceMemorySize: 7.77GiB deviceMemoryBandwidth: 417.23GiB/s
2020-09-17 11:13:41.781116: I tensorflow/core/common_runtime/gpu/gpu_device.cc:1716] Found device 1 with properties:
pciBusID: 0000:84:00.0 name: GeForce RTX 2080 computeCapability: 7.5
coreClock: 1.71GHz coreCount: 46 deviceMemorySize: 7.77GiB deviceMemoryBandwidth: 417.23GiB/s
2020-09-17 11:13:41.781938: I tensorflow/core/common_runtime/gpu/gpu_device.cc:1716] Found device 2 with properties:
pciBusID: 0000:83:00.0 name: TITAN Xp computeCapability: 6.1
coreClock: 1.582GHz coreCount: 30 deviceMemorySize: 11.91GiB deviceMemoryBandwidth: 510.07GiB/s
2020-09-17 11:13:41.782828: I tensorflow/core/common_runtime/gpu/gpu_device.cc:1716] Found device 3 with properties:
pciBusID: 0000:02:00.0 name: TITAN X (Pascal) computeCapability: 6.1
coreClock: 1.531GHz coreCount: 28 deviceMemorySize: 11.91GiB deviceMemoryBandwidth: 447.48GiB/s
2020-09-17 11:13:41.782864: I tensorflow/stream_executor/platform/default/dso_loader.cc:48] Successfully opened dynamic library libcudart.so.10.1
2020-09-17 11:13:41.785582: I tensorflow/stream_executor/platform/default/dso_loader.cc:48] Successfully opened dynamic library libcublas.so.10
2020-09-17 11:13:41.788028: I tensorflow/stream_executor/platform/default/dso_loader.cc:48] Successfully opened dynamic library libcufft.so.10
2020-09-17 11:13:41.788498: I tensorflow/stream_executor/platform/default/dso_loader.cc:48] Successfully opened dynamic library libcurand.so.10
2020-09-17 11:13:41.791183: I tensorflow/stream_executor/platform/default/dso_loader.cc:48] Successfully opened dynamic library libcusolver.so.10
2020-09-17 11:13:41.792631: I tensorflow/stream_executor/platform/default/dso_loader.cc:48] Successfully opened dynamic library libcusparse.so.10
2020-09-17 11:13:41.798078: I tensorflow/stream_executor/platform/default/dso_loader.cc:48] Successfully opened dynamic library libcudnn.so.7
2020-09-17 11:13:41.805495: I tensorflow/core/common_runtime/gpu/gpu_device.cc:1858] Adding visible gpu devices: 0, 1, 2, 3
2020-09-17 11:13:41.805961: I tensorflow/core/platform/cpu_feature_guard.cc:142] This TensorFlow binary is optimized with oneAPI Deep Neural Network Library (oneDNN)to use the following CPU instructions in performance-critical operations:  AVX2 FMA
To enable them in other operations, rebuild TensorFlow with the appropriate compiler flags.
2020-09-17 11:13:41.854901: I tensorflow/core/platform/profile_utils/cpu_utils.cc:104] CPU Frequency: 2197335000 Hz
2020-09-17 11:13:41.860757: I tensorflow/compiler/xla/service/service.cc:168] XLA service 0x561a9f04b280 initialized for platform Host (this does not guarantee that XLA will be used). Devices:
2020-09-17 11:13:41.860798: I tensorflow/compiler/xla/service/service.cc:176]   StreamExecutor device (0): Host, Default Version
2020-09-17 11:13:42.365618: I tensorflow/compiler/xla/service/service.cc:168] XLA service 0x561a9e9d7640 initialized for platform CUDA (this does not guarantee that XLA will be used). Devices:
2020-09-17 11:13:42.365673: I tensorflow/compiler/xla/service/service.cc:176]   StreamExecutor device (0): GeForce RTX 2080, Compute Capability 7.5
2020-09-17 11:13:42.365699: I tensorflow/compiler/xla/service/service.cc:176]   StreamExecutor device (1): GeForce RTX 2080, Compute Capability 7.5
2020-09-17 11:13:42.365721: I tensorflow/compiler/xla/service/service.cc:176]   StreamExecutor device (2): TITAN Xp, Compute Capability 6.1
2020-09-17 11:13:42.365736: I tensorflow/compiler/xla/service/service.cc:176]   StreamExecutor device (3): TITAN X (Pascal), Compute Capability 6.1
2020-09-17 11:13:42.377324: I tensorflow/core/common_runtime/gpu/gpu_device.cc:1716] Found device 0 with properties:
pciBusID: 0000:04:00.0 name: GeForce RTX 2080 computeCapability: 7.5
coreClock: 1.71GHz coreCount: 46 deviceMemorySize: 7.77GiB deviceMemoryBandwidth: 417.23GiB/s
2020-09-17 11:13:42.379253: I tensorflow/core/common_runtime/gpu/gpu_device.cc:1716] Found device 1 with properties:
pciBusID: 0000:84:00.0 name: GeForce RTX 2080 computeCapability: 7.5
coreClock: 1.71GHz coreCount: 46 deviceMemorySize: 7.77GiB deviceMemoryBandwidth: 417.23GiB/s
2020-09-17 11:13:42.381161: I tensorflow/core/common_runtime/gpu/gpu_device.cc:1716] Found device 2 with properties:
pciBusID: 0000:83:00.0 name: TITAN Xp computeCapability: 6.1
coreClock: 1.582GHz coreCount: 30 deviceMemorySize: 11.91GiB deviceMemoryBandwidth: 510.07GiB/s
2020-09-17 11:13:42.383961: I tensorflow/core/common_runtime/gpu/gpu_device.cc:1716] Found device 3 with properties:
pciBusID: 0000:02:00.0 name: TITAN X (Pascal) computeCapability: 6.1
coreClock: 1.531GHz coreCount: 28 deviceMemorySize: 11.91GiB deviceMemoryBandwidth: 447.48GiB/s
2020-09-17 11:13:42.384045: I tensorflow/stream_executor/platform/default/dso_loader.cc:48] Successfully opened dynamic library libcudart.so.10.1
2020-09-17 11:13:42.384097: I tensorflow/stream_executor/platform/default/dso_loader.cc:48] Successfully opened dynamic library libcublas.so.10
2020-09-17 11:13:42.384132: I tensorflow/stream_executor/platform/default/dso_loader.cc:48] Successfully opened dynamic library libcufft.so.10
2020-09-17 11:13:42.384164: I tensorflow/stream_executor/platform/default/dso_loader.cc:48] Successfully opened dynamic library libcurand.so.10
2020-09-17 11:13:42.384196: I tensorflow/stream_executor/platform/default/dso_loader.cc:48] Successfully opened dynamic library libcusolver.so.10
2020-09-17 11:13:42.384227: I tensorflow/stream_executor/platform/default/dso_loader.cc:48] Successfully opened dynamic library libcusparse.so.10
2020-09-17 11:13:42.384265: I tensorflow/stream_executor/platform/default/dso_loader.cc:48] Successfully opened dynamic library libcudnn.so.7
2020-09-17 11:13:42.393801: I tensorflow/core/common_runtime/gpu/gpu_device.cc:1858] Adding visible gpu devices: 0, 1, 2, 3
2020-09-17 11:13:42.393842: I tensorflow/stream_executor/platform/default/dso_loader.cc:48] Successfully opened dynamic library libcudart.so.10.1
2020-09-17 11:13:46.659687: I tensorflow/core/common_runtime/gpu/gpu_device.cc:1257] Device interconnect StreamExecutor with strength 1 edge matrix:
2020-09-17 11:13:46.659744: I tensorflow/core/common_runtime/gpu/gpu_device.cc:1263]      0 1 2 3
2020-09-17 11:13:46.659754: I tensorflow/core/common_runtime/gpu/gpu_device.cc:1276] 0:   N N N N
2020-09-17 11:13:46.659759: I tensorflow/core/common_runtime/gpu/gpu_device.cc:1276] 1:   N N N N
2020-09-17 11:13:46.659767: I tensorflow/core/common_runtime/gpu/gpu_device.cc:1276] 2:   N N N N
2020-09-17 11:13:46.659790: I tensorflow/core/common_runtime/gpu/gpu_device.cc:1276] 3:   N N N N
2020-09-17 11:13:46.666048: W tensorflow/core/common_runtime/gpu/gpu_bfc_allocator.cc:39] Overriding allow_growth setting because the TF_FORCE_GPU_ALLOW_GROWTH environment variable is set. Original config value was 0.
2020-09-17 11:13:46.666113: I tensorflow/core/common_runtime/gpu/gpu_device.cc:1402] Created TensorFlow device (/job:localhost/replica:0/task:0/device:GPU:0 with 7226 MB memory) -> physical GPU (device: 0, name: GeForce RTX 2080, pci bus id: 0000:04:00.0, compute capability: 7.5)
2020-09-17 11:13:46.667999: W tensorflow/core/common_runtime/gpu/gpu_bfc_allocator.cc:39] Overriding allow_growth setting because the TF_FORCE_GPU_ALLOW_GROWTH environment variable is set. Original config value was 0.
2020-09-17 11:13:46.668047: I tensorflow/core/common_runtime/gpu/gpu_device.cc:1402] Created TensorFlow device (/job:localhost/replica:0/task:0/device:GPU:1 with 7226 MB memory) -> physical GPU (device: 1, name: GeForce RTX 2080, pci bus id: 0000:84:00.0, compute capability: 7.5)
2020-09-17 11:13:46.669479: W tensorflow/core/common_runtime/gpu/gpu_bfc_allocator.cc:39] Overriding allow_growth setting because the TF_FORCE_GPU_ALLOW_GROWTH environment variable is set. Original config value was 0.
2020-09-17 11:13:46.669527: I tensorflow/core/common_runtime/gpu/gpu_device.cc:1402] Created TensorFlow device (/job:localhost/replica:0/task:0/device:GPU:2 with 921 MB memory) -> physical GPU (device: 2, name: TITAN Xp, pci bus id: 0000:83:00.0, compute capability: 6.1)
2020-09-17 11:13:46.671421: W tensorflow/core/common_runtime/gpu/gpu_bfc_allocator.cc:39] Overriding allow_growth setting because the TF_FORCE_GPU_ALLOW_GROWTH environment variable is set. Original config value was 0.
2020-09-17 11:13:46.671463: I tensorflow/core/common_runtime/gpu/gpu_device.cc:1402] Created TensorFlow device (/job:localhost/replica:0/task:0/device:GPU:3 with 4056 MB memory) -> physical GPU (device: 3, name: TITAN X (Pascal), pci bus id: 0000:02:00.0, compute capability: 6.1)
Construction finished in 0:00:05
2020-09-17 11:13:51.029187: I tensorflow/stream_executor/platform/default/dso_loader.cc:48] Successfully opened dynamic library libcublas.so.10
2020-09-17 11:13:51.570327: I tensorflow/stream_executor/platform/default/dso_loader.cc:48] Successfully opened dynamic library libcudnn.so.7
Accuracy before training: 0.0934000015258789
Epoch 1/3
300/300 [==============================] - 9s 31ms/step - loss: 0.2685 - out_p_loss: 0.2685
Epoch 2/3
300/300 [==============================] - 9s 31ms/step - loss: 0.0696 - out_p_loss: 0.0696
Epoch 3/3
300/300 [==============================] - 9s 31ms/step - loss: 0.0481 - out_p_loss: 0.0481
Accuracy after training: 0.9850999712944031 0:00:00
(nengodl) p291020@turing10:~$ e finished in 0:00:00
With my own model the output is:
(nengodl) p291020@turing10:~/Learning-to-approximate-functions-using-niobium-doped-strontium-titanate-memristors/experiments$ PYTHONPATH=.. python mPES.py -vv -f x -i sine -N 100 -d /gpu:3 -l mPES
Using run optimisation
Devices available:
Device type: CPU String: /physical_device:CPU:0
Device type: XLA_CPU String: /physical_device:XLA_CPU:0
Device type: XLA_GPU String: /physical_device:XLA_GPU:0
Device type: XLA_GPU String: /physical_device:XLA_GPU:1
Device type: XLA_GPU String: /physical_device:XLA_GPU:2
Device type: XLA_GPU String: /physical_device:XLA_GPU:3
Device type: GPU String: /physical_device:GPU:0
Device type: GPU String: /physical_device:GPU:1
Device type: GPU String: /physical_device:GPU:2
Device type: GPU String: /physical_device:GPU:3
Simulating with mPES()
Backend is nengo_dl, running on /gpu:3
Build finished in 0:00:00
Optimization finished in 0:00:00
|                                                    #            Constructing graph                                                                 | 0:00:052020-09-17 10:07:43.481718: W tensorflow/core/common_runtime/gpu/gpu_bfc_allocator.cc:39] Overriding allow_growth setting because the TF_FORCE_GPU_ALLOW_GROWTH environment variable is set. Original config value was 0.
2020-09-17 10:07:43.483678: W tensorflow/core/common_runtime/gpu/gpu_bfc_allocator.cc:39] Overriding allow_growth setting because the TF_FORCE_GPU_ALLOW_GROWTH environment variable is set. Original config value was 0.
2020-09-17 10:07:43.485466: W tensorflow/core/common_runtime/gpu/gpu_bfc_allocator.cc:39] Overriding allow_growth setting because the TF_FORCE_GPU_ALLOW_GROWTH environment variable is set. Original config value was 0.
2020-09-17 10:07:43.487683: W tensorflow/core/common_runtime/gpu/gpu_bfc_allocator.cc:39] Overriding allow_growth setting because the TF_FORCE_GPU_ALLOW_GROWTH environment variable is set. Original config value was 0.
|                                                     #           Constructing graph                                                                 | 0:00:052020-09-17 10:07:43.514308: W tensorflow/core/common_runtime/colocation_graph.cc:1139] Failed to place the graph without changing the devices of some resources. Some of the operations (that had to be colocated with resource generating operations) are not supported on the resources' devices. Current candidate devices are [
  /job:localhost/replica:0/task:0/device:CPU:0].
See below for details of this colocation group:
Colocation Debug Info:
Colocation group had the following types and supported devices:
Root Member(assigned_device_name_index_=-1 requested_device_name_='/device:GPU:3' assigned_device_name_='' resource_device_name_='/device:GPU:3' supported_device_types_=[CPU] possible_devices_=[]
ReadVariableOp: GPU CPU XLA_CPU XLA_GPU
AssignVariableOp: CPU XLA_CPU XLA_GPU
VarIsInitializedOp: GPU CPU XLA_CPU XLA_GPU
Const: GPU CPU XLA_CPU XLA_GPU
VarHandleOp: CPU XLA_CPU XLA_GPU

Colocation members, user-requested devices, and framework assigned devices, if any:
  TensorGraph/saved_state/int32_1/Initializer/zeros (Const)
  TensorGraph/saved_state/int32_1 (VarHandleOp) /device:GPU:3
  TensorGraph/saved_state/int32_1/IsInitialized/VarIsInitializedOp (VarIsInitializedOp) /device:GPU:3
  TensorGraph/saved_state/int32_1/Assign (AssignVariableOp) /device:GPU:3
  TensorGraph/saved_state/int32_1/Read/ReadVariableOp (ReadVariableOp) /device:GPU:3

Construction finished in 0:00:06

Running discretised step 1 of 1
|                 #                                                   Simulating                                                                     | 0:00:01WARNING:tensorflow:From /home/p291020/.conda/envs/nengodl/lib/python3.8/site-packages/tensorflow/python/keras/engine/training_v1.py:2070: Model.state_updates (from tensorflow.python.keras.engine.training) is deprecated and will be removed in a future version.
Instructions for updating:
This property should not be used in TensorFlow 2.0, as updates are applied automatically.
WARNING:tensorflow:From /home/p291020/.conda/envs/nengodl/lib/python3.8/site-packages/tensorflow/python/keras/engine/training_v1.py:2070: Model.state_updates (from tensorflow.python.keras.engine.training) is deprecated and will be removed in a future version.
Instructions for updating:
This property should not be used in TensorFlow 2.0, as updates are applied automatically.
Simulation finished in 0:06:37

Total time for simulation: 00:06:37 s
Maximum memory usage: 301.5 MB
MSE after learning [f(pre) vs. post]:
[0.10397076606750488, 0.23197855055332184, 0.14481531083583832]
Pearson correlation after learning [f(pre) vs. post]:
[0.8704643944583814, 0.9591849603892563, 0.984917510410567]
Spearman correlation after learning [f(pre) vs. post]:
[0.8405644401582758, 0.9417869220256265, 0.9824773736246466]
Kendall correlation after learning [f(pre) vs. post]:
[0.6274194684869902, 0.793860776251106, 0.8814211776472058]
Could it be that this is all because I’m not using the NengoDL/Keras “fit, evaluate, predict” API?