This seems to be something specific to your particular environment. I ran test_builder_mPES.py from your repo (I couldn’t find mPES.py). The only thing I changed was that I set pre_n_neurons/post_n_neurons/error_n_neurons to 100. When I ran on the CPU it took 1:19, and when I ran on the GPU it took 1:27 (not unexpected that it’s a bit slower due to all the small operations, but nothing like the 6 minutes + you’re seeing). So I don’t think it’s anything in your code, or in NengoDL, that is causing the problem. Something about your system in particular is just causing very poor GPU performance.
You’ll find mPES.py in the dev branch of my repo; sorry for not making that clear (Learning-to-approximate-functions-using-niobium-doped-strontium-titanate-memristors/experiments/mPES.py at dev · thomastiotto/Learning-to-approximate-functions-using-niobium-doped-strontium-titanate-memristors · GitHub). Would you be so kind as to test that? ![]()
I’m really curious to see how that would work on your setup!
Running mPES.py -vv -N 200 -d /cpu:0 -l mPES on the dev branch takes 0:56 (I increased N to 200 so that the CPU time would be the same ~1 minute as you’re seeing on your machine), and mPES.py -vv -N 200 -d /gpu:0 -l mPES takes 1:00.
So around the same time… unlike the 6x increase I was seeing.
What if you tested 1000 neurons on the GPU? There we should see a reasonable increase in speed? On my GPU it was taking around 20m.
Does choosing PES over mPES make any measurable difference on your GPU?
mPES.py -vv -N 200 -S 5 -d /cpu:0 -l mPES: 0:08
mPES.py -vv -N 200 -S 5 -d /gpu:0 -l mPES: 0:10
mPES.py -vv -N 200 -S 5 -d /cpu:0 -l PES: 0:01
mPES.py -vv -N 200 -S 5 -d /gpu:0 -l PES: 0:06
mPES.py -vv -N 1000 -S 5 -d /cpu:0 -l mPES: 2:52
mPES.py -vv -N 1000 -S 5 -d /gpu:0 -l mPES: 0:11
mPES.py -vv -N 1000 -S 5 -d /cpu:0 -l PES: 0:08
mPES.py -vv -N 1000 -S 5 -d /gpu:0 -l PES: 0:06
Note, I reduced the simulation time to 5 seconds because I didn’t want to wait that long.
So, we can see that PES is faster than mPES, and that when scaling up to 1000 neurons we do see the advantages of running on the GPU.
Well, that’s actually great news because at least I now now it’s not my code that’s the issue 
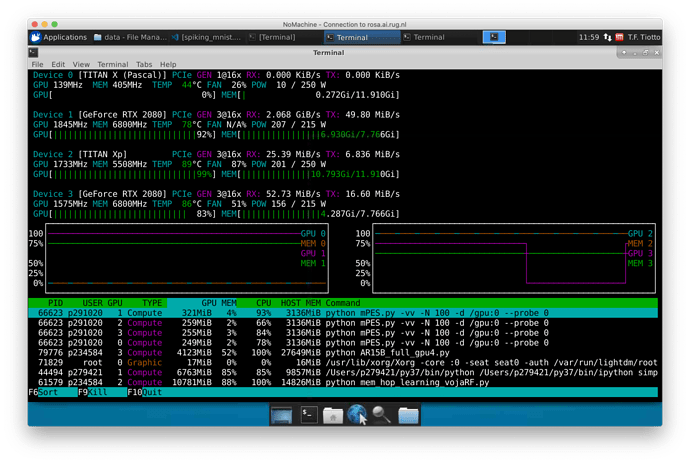
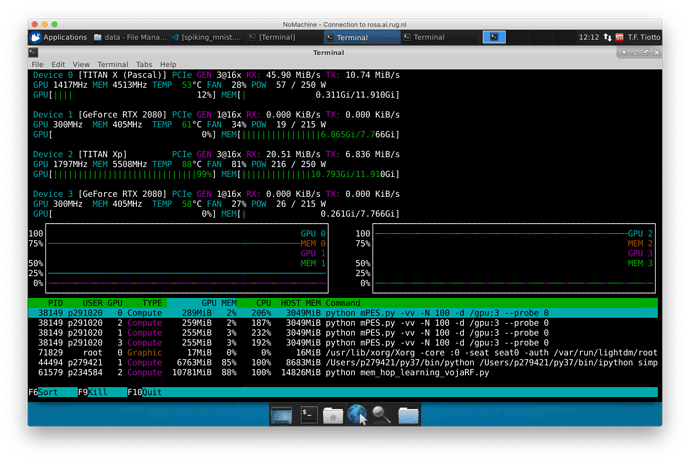
Unfortunately I’m using MacOS so I’m having to run my testing on a shared server but one thing I’m now noticing is that a GPU is being engaged but that the nengo_dl.Simulator(..., device="/gpu:[0-3]") toggle seems to assign the main computation to a different GPU than specified.
By that I mean that calling ‘mPES -d /gpu:0’ assigns the main thread (which I’m supposing being the one with GPU highest memory usage) to GPU 1, as in the first screenshot; calling ‘mPES -d /gpu:3’ assigns the main thread to GPU 0, as in the second screenshot.
If I hit on an empty GPU my running time for mPES is around 1m 30s, otherwise it shoots up to the 6m range I was seeing before.
Is it possible that the order that Tensorflow addresses the devices is different from that reported by nvidia-smi?
EDIT: digging around a bit I found that by default TensorFlow uses CUDA order for devices (0 fastest) while nvidia-smi and nvtop use physical PCI bus ordering.
I think this settles the mismatch between the parameter I was passing to the simulator and the actual GPU it was assigned to. Maybe something to make clear in the documentation for NengoDL!
Adding
import os
os.environ["CUDA_DEVICE_ORDER"]="PCI_BUS_ID"
before all imports in mPES.py seems to have made the ordering consistent.
I think that with this I can consider the issue closed now!! Thank you for all your support!
Another thing you can do to select a GPU is set os.environ["CUDA_VISIBLE_DEVICES"] = "3" (or whatever GPU you want to run on). This has the advantage of making the other GPUs completely invisible to TensorFlow, so it won’t try to grab memory on all of them as you were seeing in your memory analysis. And then once you’ve done that you don’t need to specify gpu:0, you can just let TensorFlow pick the device automatically (since there’s only one GPU available to it), and you won’t get those warnings about the colocation group allocation.
Nice, I had seen that flag but hadn’t considered using it this way.
On that note: are there any plans to make use of the tf.distribute.Strategy API?
Thanks again!
Yep that’s definitely on our TODO list! It should be relatively easy now that we’ve switched the NengoDL internals over to using eager mode.

