The Nengo team at ABR is excited to announce the first release of pytest-plt. pytest-plt is made available under the open source MIT license so that all Python projects can make use of it to better test their numerical code.
What is pytest-plt?
pytest-plt makes plotting in your tests easy by providing a plt fixture for pytest.
Create PDF plots in one line with the plt fixture.
import numpy as np
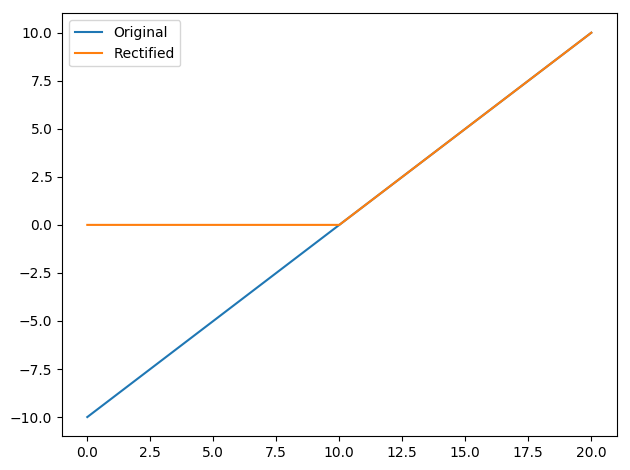
def test_rectification(plt):
values = list(range(-10, 11))
rectified = [v if v > 0 else 0 for v in values]
assert all(v >= 0 for v in rectified)
plt.plot(values, label="Original")
plt.plot(rectified, label="Rectified")
plt.legend()
To generate the plot, pass --plots to pytest.
pytest --plots
If you don’t pass --plots, calls to plt function will be ignored, meaning that your tests won’t spend time making plots that won’t get saved.
Where can I learn more?
pytest-plt gives you several ways to customize the directory that your plots end up in, and the filenames of all the plots in that directory. For the full details, see the documentation.
Where can I get help?
If you have any questions, run into any bugs, or have suggestions for new features, please file an issue on Github.