I am new to Nengo and was trying to generate a tuning plot for an Ensemble of 11 LiF Spiking Neurons. I want to plot the curve for some value -x to x V. However, Nengo by default plots the tuning curve for range -1 V to 1 V. Is there any way to expand on this range?
Just to get some context regarding your question, are you using NengoGUI (the web-based graphical interface to Nengo), or running Nengo from a python console. If you are using NengoGUI, I’m afraid it’s not possible to display tuning curve plots outside the -1 to 1 range without mucking around with the Nengo internals.
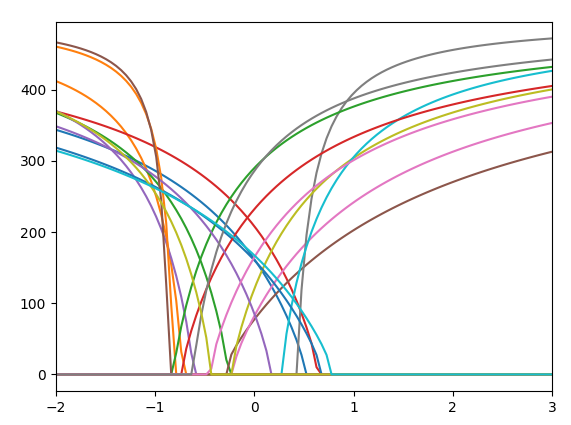
If you are using Nengo from a python console however, you can generate tuning curve plots for any range you desire using the inputs parameter to the tuning_curves function (same goes for the response_curves function). You can see an example of its use here, as well as the code below, which generates a random population of 20 neurons, and plots the tuning curves from -2 to 3.
import matplotlib.pyplot as plt
import numpy as np

import nengo
from nengo.utils.ensemble import tuning_curves


with nengo.Network() as model:
    ens = nengo.Ensemble(20, 1)

tc_inputs = np.zeros((100, 1))
tc_inputs[:, 0] = np.linspace(-2, 3, 100)
with nengo.Simulator(model) as sim:
    eval_points, activities = tuning_curves(ens, sim, inputs=tc_inputs)

plt.figure()
plt.plot(eval_points, activities)
plt.xlim(-2, 3)
plt.show()