Nengo intermittent error regarding .voltage

Plotting the voltage plot of an ensemble with a single neuron results in the following error. Is there a workaround?

Thank you,

Traceback (most recent call last):
File “c:\users\user.conda\envs\nengo3.0\lib\site-packages\nengo\builder\signal.py”, line 332, in getitem
return dict.getitem(self, key)
KeyError: Signal(name=<Neurons of <Ensemble “a_gt_b”>>.voltage[(slice(None, 1, None),)], shape=(1,))

During handling of the above exception, another exception occurred:

Traceback (most recent call last):
File “c:\users\user.conda\envs\nengo3.0\lib\site-packages\nengo_gui\page.py”, line 526, in runner
self.sim.step()
File “c:\users\user.conda\envs\nengo3.0\lib\site-packages\nengo\simulator.py”, line 372, in step
self._probe()
File “c:\users\user.conda\envs\nengo3.0\lib\site-packages\nengo\simulator.py”, line 252, in _probe
tmp = self.signals[self.model.sig[probe][“in”]].copy()
File “c:\users\user.conda\envs\nengo3.0\lib\site-packages\nengo\builder\signal.py”, line 336, in getitem
base = dict.getitem(self, key.base)
KeyError: Signal(name=<Neurons of <Ensemble “a_gt_b”>>.voltage, shape=(1,))

Hi @mmercury, and welcome back to the Nengo forums! :smiley:

I am not able to replicate the issue with the following code: test_voltage_single.py (765 Bytes)
Can you try running my code to see if you encounter the error you are reporting above?

If you are encountering the error with my code, can you tell me what version of Nengo and Python you are using?
If my code is not giving you the error, can you post some example code that will reproduce the error on your machine? I will then take that code and try to reproduce the error on my machine.

As a side note, if you want to probe the voltage of a neuron, you’ll want to do this:

voltage = nengo.Probe(neuron.neurons, "voltage")

Rather than this:

voltage = nengo.Probe(neuron.voltage)

Thanks! :slight_smile:

Hi xchoo,

Thank you for the welcome back and quick reply! I’m using
nengo 3.0.0
python 3.5.2
nengo_gui 0.4.7

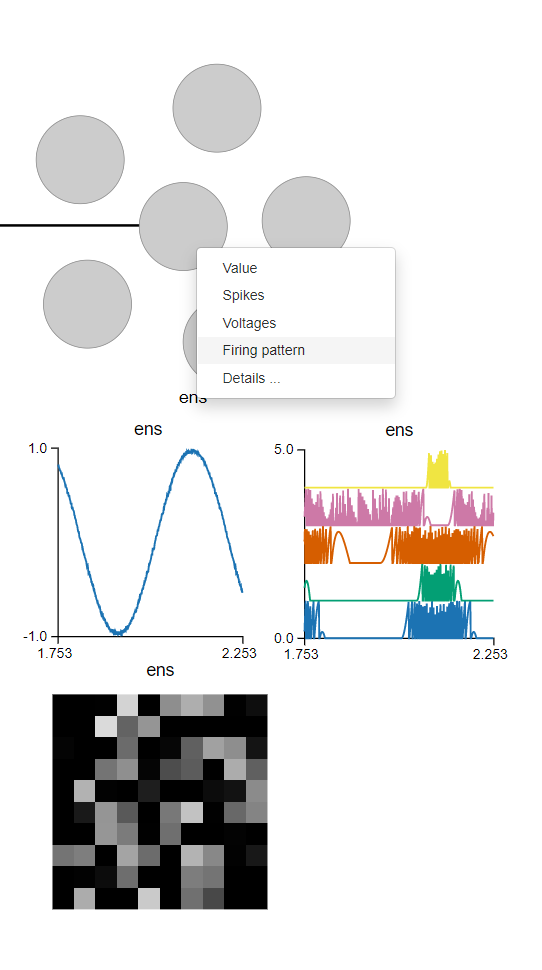
Your code worked fine on my setup. But the following code provides the error only when a voltage plots is on the gui, (i made one for ‘c’)

import nengo
from nengo.dists import Choice
import numpy as np
import pandas as pd

print(nengo.__version__)

seed = 0
sim_dt = 0.01
timeconstant = sim_dt * 1

model = nengo.Network()


with model:
    input_a = nengo.Node([0.5], label="input_a")
    input_b = nengo.Node([0.5], label="input_b")

    in_a = nengo.Ensemble(n_neurons=1, dimensions=1,label="in_a", gain=1*np.ones(1), bias=2*np.ones(1),
        neuron_type=nengo.LIF(tau_rc=timeconstant, tau_ref=sim_dt/10, min_voltage=0))
    in_b = nengo.Ensemble(n_neurons=1, dimensions=1, label="in_b", gain=1*np.ones(1), bias=2*np.ones(1),
        neuron_type=nengo.LIF(tau_rc=timeconstant, tau_ref=sim_dt/10, min_voltage=0))

    nengo.Connection(input_a, in_a.neurons, transform=1)
    nengo.Connection(input_b, in_b.neurons, transform=1)
    
    d = nengo.Ensemble(n_neurons=1, dimensions=1, label="d", gain=1*np.ones(1), bias=1*np.ones(1),
        neuron_type=nengo.LIF(tau_rc=timeconstant, tau_ref=sim_dt/10, min_voltage=0))
   
    nengo.Connection(in_a.neurons, d.neurons, transform=[[1]])
    nengo.Connection(in_b.neurons, d.neurons, transform=[[1]])
    
    c = nengo.Ensemble(n_neurons=1, dimensions=1, label="c", gain=1*np.ones(1), bias=1*np.ones(1),
        neuron_type=nengo.LIF(tau_rc=timeconstant, tau_ref=sim_dt/10, min_voltage=0))
        
    nengo.Connection(in_a.neurons, c.neurons, transform=[[1]])
    nengo.Connection(in_b.neurons, c.neurons, transform=[[1]])

Here is the error:
Traceback (most recent call last):
File “c:\users\micha.conda\envs\threefive2\lib\site-packages\nengo\builder\signal.py”, line 332, in getitem
return dict.getitem(self, key)
KeyError: Signal(name=<Neurons of <Ensemble “d”>>.voltage[(slice(None, 1, None),)], shape=(1,))

During handling of the above exception, another exception occurred:

Traceback (most recent call last):
  File "c:\users\micha\.conda\envs\threefive2\lib\site-packages\nengo_gui\page.py", line 526, in runner
    self.sim.step()
  File "c:\users\micha\.conda\envs\threefive2\lib\site-packages\nengo\simulator.py", line 372, in step
    self._probe()
  File "c:\users\micha\.conda\envs\threefive2\lib\site-packages\nengo\simulator.py", line 252, in _probe
    tmp = self.signals[self.model.sig[probe]["in"]].copy()
  File "c:\users\micha\.conda\envs\threefive2\lib\site-packages\nengo\builder\signal.py", line 336, in __getitem__
    base = dict.__getitem__(self, key.base)
KeyError: Signal(name=<Neurons of <Ensemble "d">>.voltage, shape=(1,))

Yup! That’s definitely a bug of some sort. From my initial investigation, it seems like something might be initializing out of order within Nengo / NengoGUI, specifically for voltage plots with 2 or more ensembles. I’ll submit a bug report on the Nengo github shortly.

In the mean time, I did find a work-around. On my machine, if I bring up a “Firing pattern” plot, and a “Value” plot as well as the voltage plot (for any of the ensembles in the network):

Then the voltage plots seem to run fine. :smiley:
Can you test this on your system and see if it “fixes” the issue?

EDIT: On further testing, with your code, it doesn’t seem to fix the issue. I’ll keep you posted.

Just an update, I made a bug report on the NengoGUI github. I haven’t been able to locate the source of the error, as it seems to be buried quite deep in the NengoGUI or Nengo codebase.

One definitely working work-around for this problem is to run your code in the Python console rather than through NengoGUI. If you look at the code I attached in my original reply, you’ll see how to do this.

The important difference between running things in NengoGUI vs in the Python console is that you have to do all of the probing an plotting yourself.
This code:

p_voltage = nengo.Probe(ens.neurons, "voltage")

creates the voltage probe for you.

This code:

with nengo.Simulator(model) as sim:
    sim.run(1)

runs the Nengo simulation so that data is generated.

And this code:

import matplotlib.pyplot as plt
plt.figure()
plt.plot(sim.trange(), sim.data[p_voltage])
plt.show()

generates the matplotlib figure, plots, and displays the data.

Great, good to know, thanks for your help! I’ll use the non_gui method.