How to perform a benchmark to check my GPU accelerated setup?

Excitingly, we (my lab) recently set up a new PC just for Nengo simulation.

Hardware setup
CPU: Intel® Core™ i7-6700K CPU @ 4.00GHz × 8
MB: Gigabyte Z170X-Gaming 5
RAM: King-stone 16GB*2, 32GB available
Swap: 32GB
GPU: NVIDIA GeForce GTX 1080 8GB
Storage: INTEL SSDSC2KW24 240GB
OS: Ubuntu 16.04 LTS 64-bit

GPU driver
NVIDIA binary driver - version 367.57 from nvidia-367

CUDA toolkit
nvcc --version
nvcc: NVIDIA ® Cuda compiler driver
Copyright © 2005-2016 NVIDIA Corporation
Built on Sun_Sep__4_22:14:01_CDT_2016
Cuda compilation tools, release 8.0, V8.0.44

Package versions
python 3.5
nengo==2.2.0
numpy==1.11.2
pyopencl==2016.2
nengo-ocl==1.0.0

I had run some examples for CUDA toolkit and pyopencl, I think they worked.

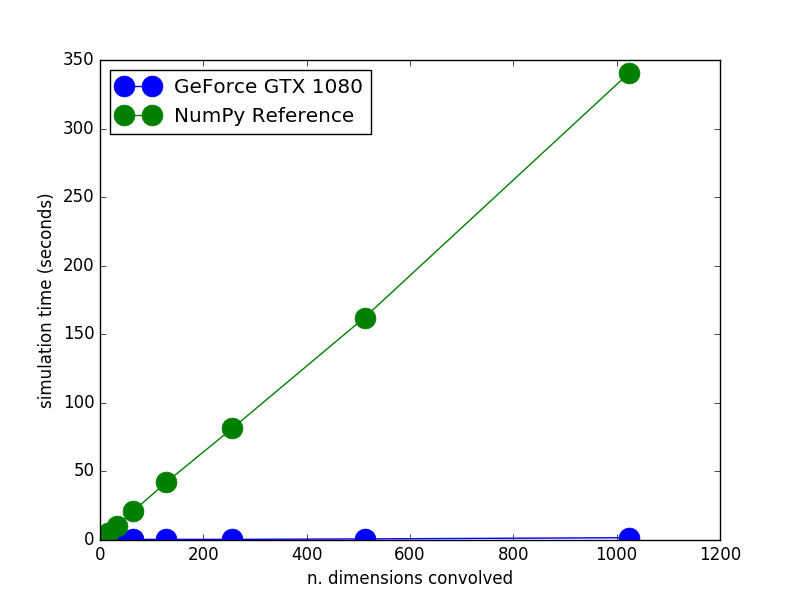
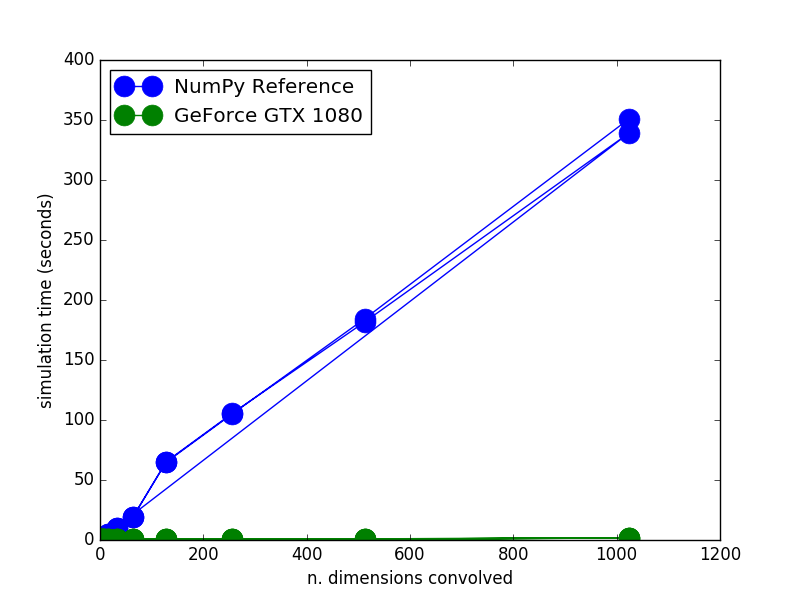
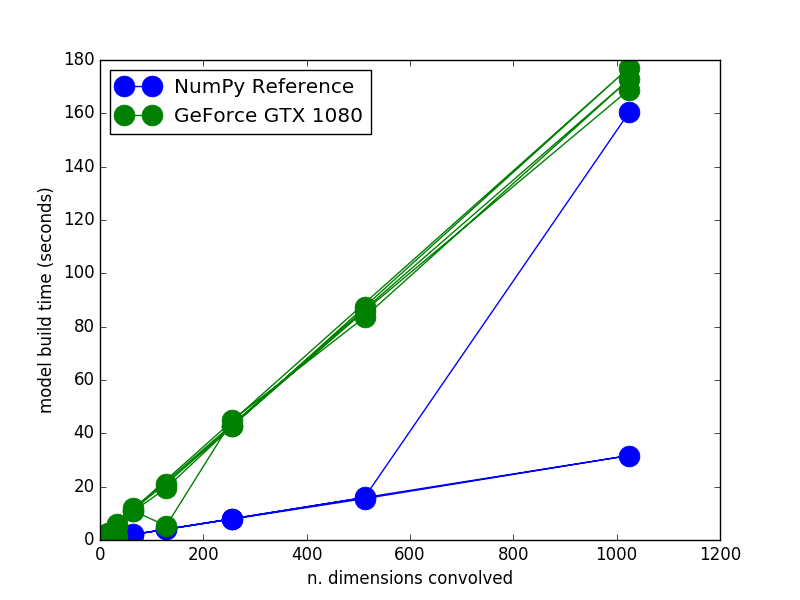
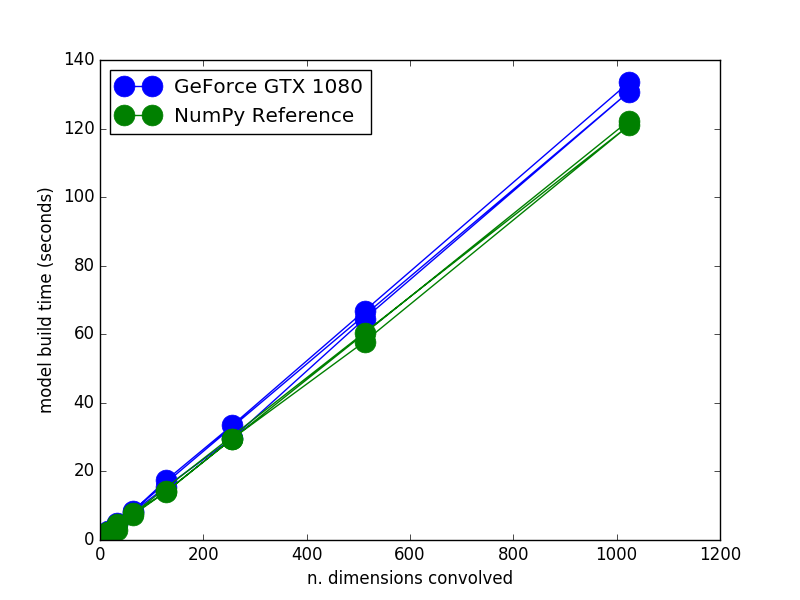
As to nengo-ocl, I’ve try to run the example files found here: https://github.com/nengo/nengo_ocl/tree/master/examples
But without instruction, I actually don’t know how to make it put out some useful information. So I’m here to ask for your advice!

Originally I thought this is an easy job, but it took me entire two days of work and reinstalling entire Ubuntu three times to get to current state.
(Yeah I’m relatively new to Linux and all these tools.)
Someday I will list out the steps I took to set up the stable system, after I test nengo-ocl really works.

Excitingly, we (my lab) recently set up a new PC just for Nengo simulation.

Out of curiosity, what lab are you working with?

Originally I thought this is an easy job, but it took me entirely two days of work and reinstalling entire Ubuntu three times to get to current state.

OpenCL builds are incredibly painful, as @xchoo can confirm. That amount of time to setup is pretty typical and any documentation of the process would be greatly appreciated.

But without instruction, I actually don’t know how to make it put out some useful information. So I’m here to ask for your advice!

I’ve got a couple of questions for you to make sure we can help you in the best way possible.

  1. Have you run Nengo models before without the Nengo OCL backend? I noticed your previous post asked about the “How to Build a Brain” examples, but I don’t know if you got around to running them.
  2. Do you know what I mean when I write “backend”?
1 Like

I do research in Cognitive NeuralRobotics Group at National Taiwan University.

  1. I had run nengo_gui for quick test, I’m assuming the backend of nengo GUI platform is nengo 2.0 reference simulator, right?
  2. As I know, after I set up a neural network model, I get few options to simulate that, nengo.simulator or nengo_ocl.simulator for instance, which are referring to two different simulator backends. Am I right?

Your are correct on both accounts! :smiley:

Back to your original question, what type of output are you hoping to get? Would you like an example to compare the simulation speed of the nengo.simulator and nengo_ocl.simulator? Or would you like something else?

Hi Seanny123,

Yes, I would like some example code to compare the two simulator.
Of course I should be able to create one by my own, but I just wondering whether if there is a fairly standard test example already exists. (As I saw some scripts in the nengo_ocl github repository, or they were not meant to go public.)

Edward Chen

Hi everyone,

After I looked into the codes of the test examples ( https://github.com/nengo/nengo_ocl/tree/master/examples ),
I figured out how to utilize them. Here are some results:

The steps I went to run these:

  1. Switch to the scripts folder and login as root.
  2. Run the benchmark example.
    python3 benchmark_circconv.py ref 1,2,4,8,16,32,64,128,256,512,1024
    python3 benchmark_circconv.py ocl 1,2,4,8,16,32,64,128,256,512,1024
  3. Then view the results with:
    python3 view_records.py *.pkl

Some observations here,

  1. The compilation of the neural network model takes some time (in proportion to the scale of network?), this process only utilized one CPU core, so a multi-core CPU seems not helping.
  2. When simulate with reference simulator, still only one core is utilized, was this normal?

Edward Chen

The number of CPU cores used depends on your BLAS setup for Numpy (see here).

Depending on the sizes of your ensembles, the reference simulator may still only use one core even if it’s set up with multi-core BLAS. If you really want to compare your CPU to your GPU, try running the OpenCL backend on your CPU.

Thanks for posting the steps and the results @edward17829991, nice to see results on different hardware! Will be interested to see the results with OpenCL on a CPU and with a different BLAS installed (you could also try the MKL-optimized NumPy that is available through conda)).

Hi Eric,

Big thanks to your suggestion, BLAS setup really works!
Now numpy utilizes all the cores flawlessly.

(running the benchmark code provided at BLAS setup for Numpy page, mentioned by @Eric previously.)
native numpy from Anaconda:

dotted two (1000,1000) matrices in 1138.7 ms
dotted two (4000) vectors in 5.98 us
SVD of (2000,1000) matrix in 8.394 s
Eigendecomp of (1500,1500) matrix in 23.233 s

numpy with BLAS:

dotted two (1000,1000) matrices in 21.4 ms
dotted two (4000) vectors in 1.79 us
SVD of (2000,1000) matrix in 0.478 s
Eigendecomp of (1500,1500) matrix in 8.060 s

verify of BLAS working:

>>> import numpy
>>> numpy.show_config()
openblas_lapack_info:
    libraries = ['openblas', 'openblas']
    language = c
    define_macros = [('HAVE_CBLAS', None)]
    library_dirs = ['/opt/openblas/lib']
openblas_info:
    libraries = ['openblas', 'openblas']
    language = c
    define_macros = [('HAVE_CBLAS', None)]
    library_dirs = ['/opt/openblas/lib']
lapack_opt_info:
    libraries = ['openblas', 'openblas']
    language = c
    define_macros = [('HAVE_CBLAS', None)]
    library_dirs = ['/opt/openblas/lib']
blas_mkl_info:
  NOT AVAILABLE
blas_opt_info:
    libraries = ['openblas', 'openblas']
    language = c
    define_macros = [('HAVE_CBLAS', None)]
    library_dirs = ['/opt/openblas/lib']

Benchmark results of nengo simulation with BLAS enhanced numpy:

Kind of boring, simulation time of reference simulator didn’t do any noticeable improvement. But I check the CPU’s core usage (screen-shot below), all cores are busy (used to be only one core). Why did it perform the same speed as only one core? I’m guessing the simulation process got some concurrent issue to deal with, so the overall process was blocked. (I did sometime spot a situation that most cores were busy at lower percentage, e.g. most of the cores were at 60%, and one or two core at 100%.)

As to the model build time, here are some exciting and interesting result:
(I modified the view_records.py file to plot out the build time)

Below is the build time with BLAS enhanced numpy:

As a reference, below is the build time with native numpy:


Build time did improve a lot, all cores were busy at 100% when building model.
But something weird there, build time improved when using reference simulator, degenerated for nengo_ocl simulator.

Another strange thing is that at the model build time with BLAS enhanced numpy, sometimes rate lines of two device seems to jump to the other line as if for a moment process build the model in the other way.

To @tbekolay, thanks for your work and suggestion, I’ll definitely keep updating my little experience while learning.

Edward Chen

There are many weird things going on. Can you post your benchmarking script?

EDIT: Never mind. It’s just benchmark_circconv.py but you wrote a thing to plot the build times, too, right?

The thing that’s strange to me with the build, is that sometimes nengo_ocl is almost as fast as nengo (128 dims, one point), and sometimes nengo is almost as slow (1024 dims, one point). I’m wondering if there’s something else going on that is sometimes making it slow.

One thing it could be is cache effects. We cache models once they’ve been built to save time. If you really want to compare how long it takes to build from scratch, you should turn off the cache, either by modifying your nengo_rc file or by removing the model seed (search for seed=9 in benchmark_circconv.py).

And with regards to the simulation speed not improving with more cores, that’s not surprising. nengo has a lot of overhead for models with many small ensembles, such as the one you’re running, since it has to make a call to numpy for each ensemble. There’s things in the works to improve this. That’s why I suggested using nengo_ocl on your CPU if you want to compare CPU and GPU.

Hi Eric,

I think you are right, the phenomenon might due to the cache.

Here are some results with seed=9 removed:

So my conclusion is that, the build time (for dimemsion=1024) is around 750 sec with native numpy and ~130sec with BLAS enhanced numpy. As to the build time below 30 sec was because the cache mechanism kicked in. Right?

Edward Chen

Yes, that looks right. I’m glad you’ve got it working!