I have a network that is behaving in a weird way and I’m not sure what I am missing (or if it is a bug). I am trying to compute the squared length of a spa.State (acting as memory with a feedback) by adding an additional output to the internal ensemble array to compute the squares. These are then projected into a single ensemble. For some reason the result is considerably larger than expected. If I probe the output of that spa.State and do the calculations with NumPy, I get the expected result, so the represented value is correct.
If I feed the output of the State into another State and calculate the squared length in the same way (adding squared output, projecting to 1d ensemble), it works.
Here is some code:
import matplotlib.pyplot as plt
import nengo
from nengo import spa

d = 128
with spa.SPA() as model:
    model.diff = spa.State(d)
    model.state = spa.State(d, subdimensions=1, feedback=1.)
    model.copy = spa.State(d, subdimensions=1)

    nengo.Connection(model.diff.output, model.state.input, transform=10.)
    nengo.Connection(model.state.output, model.diff.input, transform=-1.)

    nengo.Connection(model.state.output, model.copy.input)

    state_sq = model.state.state_ensembles.add_output('sq', np.square)
    copy_sq = model.copy.state_ensembles.add_output('sq', np.square)

    state_sq_length = nengo.Ensemble(150, 1)
    copy_sq_length = nengo.Ensemble(150, 1)

    nengo.Connection(state_sq, state_sq_length, transform=np.ones((1, d)))
    nengo.Connection(copy_sq, copy_sq_length, transform=np.ones((1, d)))

    model.stim = spa.Input(diff='A')

    p_state = nengo.Probe(model.state.output, synapse=0.01)
    p_copy = nengo.Probe(model.copy.output, synapse=0.01)
    p_state_sq_length = nengo.Probe(state_sq_length, synapse=0.01)
    p_copy_sq_length = nengo.Probe(copy_sq_length, synapse=0.01)

with nengo.Simulator(model) as sim:
    sim.run(1.)

plt.figure()
plt.plot(sim.trange(), sim.data[p_state_sq_length], label='state_sq_length')
plt.plot(sim.trange(), np.sum(np.square(sim.data[p_state]), axis=1), label='state')
plt.plot(sim.trange(), sim.data[p_copy_sq_length], label='copy_sq_length')
plt.plot(sim.trange(), np.sum(np.square(sim.data[p_copy]), axis=1), label='copy')
plt.xlabel('Time (s)')
plt.ylabel('Squared length')
plt.legend(loc='best')
plt.show()
Output plot:
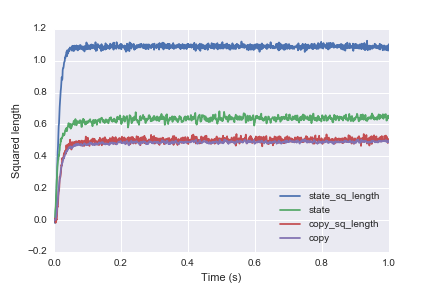
The blue line is the initial attempt that is way larger than the analytical calculation from the probed output (green line). By feeding the output into another State neural and analytical result (red and purple line) agree.
Can anyone explain to me why this is happening?
