Hi everyone,
I’m currently researching the learning algorithms in Nengo, particularly focusing on the PES algorithm (Learning a communication channel — Nengo 4.0.1.dev0 docs). I have a question: if the network’s input and label data are entirely unrelated, can the PES algorithm still learn the label data effectively?
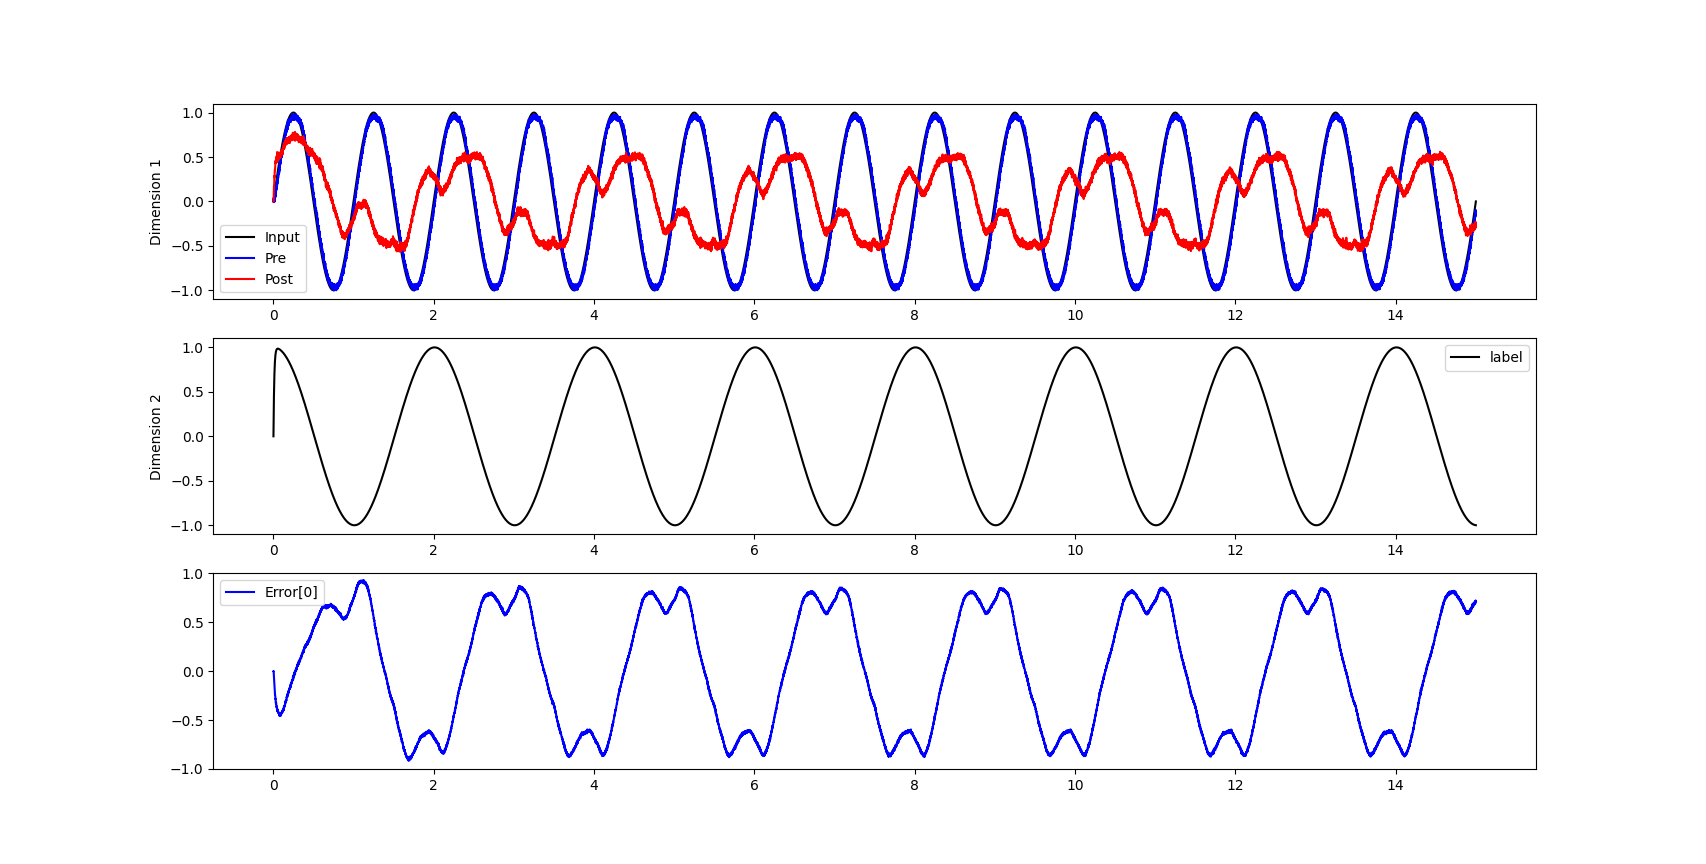
To explore this, I wrote a simple test code where the network input is a sine function, and the label is a cosine function. However, the results were unsatisfactory. I’m puzzled as to why this is the case.
This issue has been troubling me for quite some time, and I would greatly appreciate any insights or solutions. Of course, any thoughts or ideas are welcome. Looking forward to the discussion!
import matplotlib.pyplot as plt
import numpy as np
import nengo
from nengo.processes import WhiteSignal
from nengo.solvers import LstsqL2

np.random.seed(10)

model = nengo.Network()
with model:
    inp = nengo.Node(output=lambda t: np.sin(2 * np.pi * t))
    pre = nengo.Ensemble(60, dimensions=1)
    nengo.Connection(inp, pre)
    post = nengo.Ensemble(60, dimensions=1)
    conn = nengo.Connection(pre, post, function=lambda x: np.random.random(1))
    inp_p = nengo.Probe(inp)
    pre_p = nengo.Probe(pre, synapse=0.01)
    post_p = nengo.Probe(post, synapse=0.01)
    error = nengo.Ensemble(60, dimensions=1)
    error_p = nengo.Probe(error, synapse=0.03)
    label_output_node = nengo.Node(output=lambda t: np.cos(np.pi * t))

    # Error = actual - target = post - pre
    nengo.Connection(post, error)
    nengo.Connection(label_output_node, error, transform=-1)

    # Add the learning rule to the connection
    conn.learning_rule_type = nengo.PES()

    # Connect the error into the learning rule
    nengo.Connection(error, conn.learning_rule)
    p_expected_output_node = nengo.Probe(label_output_node, synapse=0.01)
with nengo.Simulator(model) as sim:
    sim.run(15.0)

plt.figure(figsize=(12, 12))
plt.subplot(3, 1, 1)
plt.plot(sim.trange(), sim.data[inp_p], c="k", label="Input")
plt.plot(sim.trange(), sim.data[pre_p], c="b", label="Pre")
plt.plot(sim.trange(), sim.data[post_p], c="r", label="Post")
plt.ylabel("Dimension 1")
plt.legend(loc="best")
plt.subplot(3, 1, 2)
plt.plot(sim.trange(), sim.data[p_expected_output_node], c="k", label="label")
# plt.plot(sim.trange(), sim.data[pre_p].T[1], c="b", label="Pre")
# plt.plot(sim.trange(), sim.data[post_p].T[1], c="r", label="Post")
plt.ylabel("Dimension 2")
plt.legend(loc="best")
plt.subplot(3, 1, 3)
plt.plot(sim.trange(), sim.data[error_p], c="b")
plt.ylim(-1, 1)
plt.legend(("Error[0]", "Error[1]"), loc="best")
plt.show()