Hi all! I am just starting my journey into this awesome world. I have a possibly dumb question. If I have a csv of IMU data from an accelerometer how can I use that as an input to a nengo.Node(). I have gone through the MINST tutorial but it doesn’t seem to translate very well for a vector capturing a signal at a specific sampling freq. Is there a way to feed a numpy array into a Node?
Here is an example of what I am working with:
%matplotlib inline
import matplotlib.pyplot as plt
import numpy as np

import nengo

x = df_walking.iloc[0,:-1].values

model_test = nengo.Network(label="Communications Channel")
with model_test:
    # Create input signal from x
    accel_x = nengo.Node(x)

with model_test:
    accel_x_probe = nengo.Probe(accel_x)


with nengo.Simulator(model_test) as sim:
    sim.run(2)
plt.figure()
plt.subplot(2, 1, 1)
plt.plot(sim.trange(), sim.data[accel_x_probe], lw=2)
plt.title("Input")
Hello @bdina! Welcome to our equally awesome community. Can you be more specific of your ask here? From your posted code, x = df_walking.iloc[0,:-1].values implies that you are fetching all the column values (except the last) in the row at the 0th index and then outputting that x through accel_x = nengo.Node(x) for the entire simulation time. You can check the nengo.Node API here where the first argument to is the “output” expected from the Node. Thus you are getting the same fixed column values in the first row for the entire simulation (in your first plot).
I am assuming that you have a data-frame of sampled signal values and want to output “each” of the rows sequentially through a nengo Node. In other works, in every time-step of your simulation you want a new vector of signal values, and those vectors are consecutively arranged as rows in your data-frame. Is it? Please clarify your expected output from the Node at every time-step. If possible, an example would help.
@zerone This is the fastest response I have gotten on any forum so I am happy to be here!
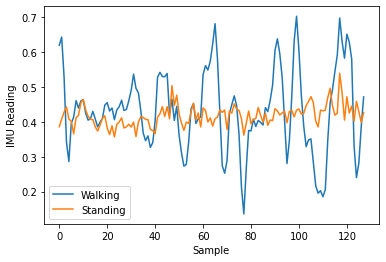
So I have some raw IMU data that I read in with pandas. each row has 128 samples which correspond to a 2.5 sec reading of some filtered accelerometer data each row, the last column is the label. The plot shown in my second post shows what I am trying to read in. I guess my first question is how can I read in a csv item by item into a Node to simulate feeding IMU data into the simulation. I am trying to make a model that predicts activity but figured baby steps lol.
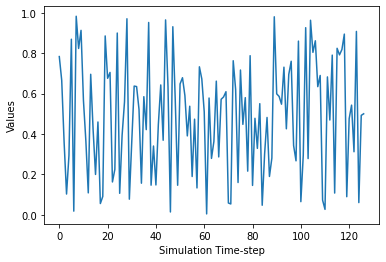
What I expect:
the output of the node when probed looks like the following graph except with only one signal:
So to summarize just trying to understand how I can read in a csv one sample at a time. Thanks again and sorry for any ignorance I may be showing, I have looked at the APIs and I’m not sure how to go from a function like shown in the examples to just streaming in data from a file source.
Hello @bdina, thanks for clarifying. What I understand from your above comment is that you are trying to access each of the 127 elements of a row in your data-frame through nengo.Node. Here’s the following code to do it.
I created a random data-frame of 100 rows and 128 columns.
Next, the following function is passed as “callable” to nengo.Node(). Keep in mind that while writing a “callable” function, it accepts only one argument and that’s a time variable. This time variable is the time-step of the simulation, i.e. at each of simulation steps, the current time-step will be passed to this function by the simulator. This also implies that the increment in variable time t (in the function) will depend on the variable dt in the nengo.Simulator. So if you happen to mention dt=1e-4 the variable t will increase by 1e-4 in every time-step. Try print(t) to see the effect. You will also notice the floating point precision errors which you might have to keep account of while dealing with this variable.
def generate_signal(t):
  """
  t <float>: The time-step of the simulation, e.g. 0.001, 0.002, etc.
  """
  dt = 1e-3 # The time-step duration in nengo.Simulator().
  col_idx = int(t * 1/dt)
  return df.iloc[0, col_idx] # Return the column values of first row.
Now, run the simulation. Do note that I am running it for only 0.127s duration (i.e. 127ms, I am planning to access all the 128 column values, you might run it for 0.126s for accessing just 127 values).
with nengo.Network() as net:
  inp_node = nengo.Node(output=generate_signal)
  inp_node_probe = nengo.Probe(inp_node)

with nengo.Simulator(net, dt=1e-3) as sim:
  sim.run(0.127)
Just to elaborate on the internals of a nengo.Node, the Nengo nodes are designed to function as signal generators. That is to say, it functions like a function with one input: the current timestamp t, and produces an output signal. It should be noted that the output signal can be a vector of any dimensionality (a scale would just be a vector with 1 element).
As a shortcut, you can also construct nengo.Nodes by passing it a static output value. In this case, the Nengo backend creates a function like so (note: this is a high level description of what the code is doing, not necessarily an exact representation):
def my_func(t):
    return <static_value>

with nengo.Network() as net:
    my_node = nengo.Node(output=my_func)
and uses it for the node’s output function. Thus, when you created a Nengo node and passed in your entire data timeseries, Nengo considered the entire timeseries as 1 static output vector and just returned that on every simulation timestep.
As @zerone described, if you want your Nengo node to output each item in your time series data instead of the entire thing, you’ll want to encapsulate your time series data into a function, and have that function “parse” your data for you.
The cool thing about nengo.Nodes is that you can use a lambda function to define the output function. For your use case, assuming the data in your dataframe was recorded at samp_freq Hz, the following code should work for you:
with nengo.Network() as net:
    accel_x = nengo.Node(lambda t: df_walking.iloc[0, int(t * samp_freq)])
Another thing I should note is that the first Nengo timestep is at t=dt, so you’ll have to adjust your time series data accordingly. Some data assumes the first timestep is at t=0.
@xchoo Thanks for the explanation! Yeah it is pretty cool I started incorporating the sample frequency last night. Working on a research project evaluating how Spiking Nets can help with transfer efficiency for imbalanced class data. One of my datasets is a bunch of IMU data with labels. Thanks again this is a really good community hopefully I can contribute more then just questions lol.